Building Optimization with Dask
This notebook uses Dask to parrallize the NSGAII alogrithm. Most of this notebook is copied from the “BuildingOptimization” notebook. But, this notebook will skip over concepts unrelated to Dask. Go to examples/Optimization/BuildingOptimization.ipynb for more details about the notebook.
Setup dask
To use Dask setup the scheduler and the workers by runnning the cell below. The client object is used to get and set various dask settings such as the number of workers.
If you’re running this notebook locally, you should be able to open the dashboard using the link provided by client.
import pandas as pd
from besos import eppy_funcs as ef
from besos.evaluator import EvaluatorEP
from besos.optimizer import NSGAII
from besos.parameters import RangeParameter, expand_plist, wwr
from besos.problem import EPProblem
from matplotlib import pyplot as plt

from dask.distributed import Client
client = Client()
client
Client
|
Cluster
|
Building Optimization setup
building = ef.get_building("in.idf") # Load the E+ model in.idf
parameters = []
parameters = expand_plist(  # Use helper function to make parameter list
    {
        "Building 1": {"North Axis": (0, 359)}  # Name from IDF Building object
    }  # Change orientation from North
)

parameters.append(
    wwr(RangeParameter(0.1, 0.9))
)  # Add window-to-wall ratio as a parameter between 0.1 and 0.9 using a custom function
objectives = [
    "DistrictCooling:Facility",
    "DistrictHeating:Facility",
]  # Use Heating and Cooling (Ideal air loads) as objectives
problem = EPProblem(
    parameters, objectives
)  # Make a problem instance from the parameters and objectives
Set up EnergyPlus evaluator
The Energy Plus evaluator must have more then one process to enable multiprocessing. This disables the caching functionality of the evaluator which is incompatible with multiprocessing.
In this cell, a evaluator is created and one simulation is run as a test
evaluatorEP = EvaluatorEP(
    problem, building
)  # outputdir must exist; E+ files will be written there
runs = pd.DataFrame.from_dict(
    {"0": [180, 0.5]}, orient="index"
)  # Make a dataframe of runs with one entry for South and 50% glazing
outputs = evaluatorEP.df_apply(runs)  # Run this as a test
outputs
HBox(children=(FloatProgress(value=0.0, description='Executing', max=1.0, style=ProgressStyle(description_widt…
| DistrictCooling:Facility | DistrictHeating:Facility | |
|---|---|---|
| 0 | 3.233564e+09 | 4.931726e+09 |
Run the Genetic Algorithm
Run the genetic algorithm. Because the evaluator was created with more then one process the algorithm will also use multiprocessing For each iteration of the algorithm, the evaluator will be run in parrallel for each worker available (indicated by the Dask client objct).
You might also see a bunch of warnings along the lines of “..full garbage collections…”. I’m not sure exactly what’s causing them, but restarting the workers from time to time will help minimize the warnings ~ goh.
%%time
results = NSGAII(
    evaluatorEP, evaluations=20, population_size=50
)  # Run the optimizer using this evaluator for a population size of 20 for 10 generations
results
distributed.utils_perf - WARNING - full garbage collections took 46% CPU time recently (threshold: 10%)
distributed.utils_perf - WARNING - full garbage collections took 48% CPU time recently (threshold: 10%)
distributed.utils_perf - WARNING - full garbage collections took 48% CPU time recently (threshold: 10%)
distributed.utils_perf - WARNING - full garbage collections took 49% CPU time recently (threshold: 10%)
distributed.utils_perf - WARNING - full garbage collections took 50% CPU time recently (threshold: 10%)
distributed.utils_perf - WARNING - full garbage collections took 49% CPU time recently (threshold: 10%)
distributed.utils_perf - WARNING - full garbage collections took 49% CPU time recently (threshold: 10%)
distributed.utils_perf - WARNING - full garbage collections took 50% CPU time recently (threshold: 10%)
distributed.utils_perf - WARNING - full garbage collections took 50% CPU time recently (threshold: 10%)
distributed.utils_perf - WARNING - full garbage collections took 50% CPU time recently (threshold: 10%)
distributed.utils_perf - WARNING - full garbage collections took 51% CPU time recently (threshold: 10%)
distributed.utils_perf - WARNING - full garbage collections took 50% CPU time recently (threshold: 10%)
distributed.utils_perf - WARNING - full garbage collections took 51% CPU time recently (threshold: 10%)
distributed.utils_perf - WARNING - full garbage collections took 50% CPU time recently (threshold: 10%)
distributed.utils_perf - WARNING - full garbage collections took 50% CPU time recently (threshold: 10%)
distributed.utils_perf - WARNING - full garbage collections took 50% CPU time recently (threshold: 10%)
distributed.utils_perf - WARNING - full garbage collections took 50% CPU time recently (threshold: 10%)
distributed.utils_perf - WARNING - full garbage collections took 50% CPU time recently (threshold: 10%)
distributed.utils_perf - WARNING - full garbage collections took 50% CPU time recently (threshold: 10%)
distributed.utils_perf - WARNING - full garbage collections took 50% CPU time recently (threshold: 10%)
distributed.utils_perf - WARNING - full garbage collections took 49% CPU time recently (threshold: 10%)
distributed.utils_perf - WARNING - full garbage collections took 50% CPU time recently (threshold: 10%)
distributed.utils_perf - WARNING - full garbage collections took 50% CPU time recently (threshold: 10%)
distributed.utils_perf - WARNING - full garbage collections took 50% CPU time recently (threshold: 10%)
distributed.utils_perf - WARNING - full garbage collections took 50% CPU time recently (threshold: 10%)
distributed.utils_perf - WARNING - full garbage collections took 49% CPU time recently (threshold: 10%)
distributed.utils_perf - WARNING - full garbage collections took 49% CPU time recently (threshold: 10%)
distributed.utils_perf - WARNING - full garbage collections took 50% CPU time recently (threshold: 10%)
distributed.utils_perf - WARNING - full garbage collections took 49% CPU time recently (threshold: 10%)
distributed.utils_perf - WARNING - full garbage collections took 50% CPU time recently (threshold: 10%)
distributed.utils_perf - WARNING - full garbage collections took 50% CPU time recently (threshold: 10%)
distributed.utils_perf - WARNING - full garbage collections took 49% CPU time recently (threshold: 10%)
distributed.utils_perf - WARNING - full garbage collections took 49% CPU time recently (threshold: 10%)
distributed.utils_perf - WARNING - full garbage collections took 49% CPU time recently (threshold: 10%)
distributed.utils_perf - WARNING - full garbage collections took 48% CPU time recently (threshold: 10%)
distributed.utils_perf - WARNING - full garbage collections took 49% CPU time recently (threshold: 10%)
distributed.utils_perf - WARNING - full garbage collections took 49% CPU time recently (threshold: 10%)
distributed.utils_perf - WARNING - full garbage collections took 48% CPU time recently (threshold: 10%)
distributed.utils_perf - WARNING - full garbage collections took 49% CPU time recently (threshold: 10%)
distributed.utils_perf - WARNING - full garbage collections took 48% CPU time recently (threshold: 10%)
distributed.utils_perf - WARNING - full garbage collections took 49% CPU time recently (threshold: 10%)
distributed.utils_perf - WARNING - full garbage collections took 49% CPU time recently (threshold: 10%)
distributed.utils_perf - WARNING - full garbage collections took 49% CPU time recently (threshold: 10%)
distributed.utils_perf - WARNING - full garbage collections took 49% CPU time recently (threshold: 10%)
distributed.utils_perf - WARNING - full garbage collections took 49% CPU time recently (threshold: 10%)
distributed.utils_perf - WARNING - full garbage collections took 48% CPU time recently (threshold: 10%)
distributed.utils_perf - WARNING - full garbage collections took 48% CPU time recently (threshold: 10%)
distributed.utils_perf - WARNING - full garbage collections took 49% CPU time recently (threshold: 10%)
distributed.utils_perf - WARNING - full garbage collections took 48% CPU time recently (threshold: 10%)
distributed.utils_perf - WARNING - full garbage collections took 47% CPU time recently (threshold: 10%)
distributed.utils_perf - WARNING - full garbage collections took 48% CPU time recently (threshold: 10%)
distributed.utils_perf - WARNING - full garbage collections took 48% CPU time recently (threshold: 10%)
distributed.utils_perf - WARNING - full garbage collections took 48% CPU time recently (threshold: 10%)
distributed.utils_perf - WARNING - full garbage collections took 49% CPU time recently (threshold: 10%)
distributed.utils_perf - WARNING - full garbage collections took 48% CPU time recently (threshold: 10%)
distributed.utils_perf - WARNING - full garbage collections took 49% CPU time recently (threshold: 10%)
distributed.utils_perf - WARNING - full garbage collections took 48% CPU time recently (threshold: 10%)
distributed.utils_perf - WARNING - full garbage collections took 47% CPU time recently (threshold: 10%)
distributed.utils_perf - WARNING - full garbage collections took 48% CPU time recently (threshold: 10%)
distributed.utils_perf - WARNING - full garbage collections took 47% CPU time recently (threshold: 10%)
distributed.utils_perf - WARNING - full garbage collections took 47% CPU time recently (threshold: 10%)
distributed.utils_perf - WARNING - full garbage collections took 48% CPU time recently (threshold: 10%)
distributed.utils_perf - WARNING - full garbage collections took 48% CPU time recently (threshold: 10%)
distributed.utils_perf - WARNING - full garbage collections took 48% CPU time recently (threshold: 10%)
distributed.utils_perf - WARNING - full garbage collections took 49% CPU time recently (threshold: 10%)
distributed.utils_perf - WARNING - full garbage collections took 48% CPU time recently (threshold: 10%)
distributed.utils_perf - WARNING - full garbage collections took 47% CPU time recently (threshold: 10%)
distributed.utils_perf - WARNING - full garbage collections took 49% CPU time recently (threshold: 10%)
distributed.utils_perf - WARNING - full garbage collections took 48% CPU time recently (threshold: 10%)
distributed.utils_perf - WARNING - full garbage collections took 48% CPU time recently (threshold: 10%)
distributed.utils_perf - WARNING - full garbage collections took 48% CPU time recently (threshold: 10%)
distributed.utils_perf - WARNING - full garbage collections took 48% CPU time recently (threshold: 10%)
distributed.utils_perf - WARNING - full garbage collections took 48% CPU time recently (threshold: 10%)
distributed.utils_perf - WARNING - full garbage collections took 49% CPU time recently (threshold: 10%)
distributed.utils_perf - WARNING - full garbage collections took 48% CPU time recently (threshold: 10%)
distributed.utils_perf - WARNING - full garbage collections took 49% CPU time recently (threshold: 10%)
distributed.utils_perf - WARNING - full garbage collections took 48% CPU time recently (threshold: 10%)
distributed.utils_perf - WARNING - full garbage collections took 48% CPU time recently (threshold: 10%)
distributed.utils_perf - WARNING - full garbage collections took 48% CPU time recently (threshold: 10%)
distributed.utils_perf - WARNING - full garbage collections took 47% CPU time recently (threshold: 10%)
distributed.utils_perf - WARNING - full garbage collections took 48% CPU time recently (threshold: 10%)
distributed.utils_perf - WARNING - full garbage collections took 48% CPU time recently (threshold: 10%)
distributed.utils_perf - WARNING - full garbage collections took 48% CPU time recently (threshold: 10%)
distributed.utils_perf - WARNING - full garbage collections took 48% CPU time recently (threshold: 10%)
distributed.utils_perf - WARNING - full garbage collections took 49% CPU time recently (threshold: 10%)
distributed.utils_perf - WARNING - full garbage collections took 48% CPU time recently (threshold: 10%)
distributed.utils_perf - WARNING - full garbage collections took 48% CPU time recently (threshold: 10%)
distributed.utils_perf - WARNING - full garbage collections took 48% CPU time recently (threshold: 10%)
distributed.utils_perf - WARNING - full garbage collections took 48% CPU time recently (threshold: 10%)
distributed.utils_perf - WARNING - full garbage collections took 48% CPU time recently (threshold: 10%)
distributed.utils_perf - WARNING - full garbage collections took 48% CPU time recently (threshold: 10%)
distributed.utils_perf - WARNING - full garbage collections took 48% CPU time recently (threshold: 10%)
distributed.utils_perf - WARNING - full garbage collections took 49% CPU time recently (threshold: 10%)
distributed.utils_perf - WARNING - full garbage collections took 48% CPU time recently (threshold: 10%)
distributed.utils_perf - WARNING - full garbage collections took 48% CPU time recently (threshold: 10%)
distributed.utils_perf - WARNING - full garbage collections took 48% CPU time recently (threshold: 10%)
distributed.utils_perf - WARNING - full garbage collections took 48% CPU time recently (threshold: 10%)
distributed.utils_perf - WARNING - full garbage collections took 48% CPU time recently (threshold: 10%)
distributed.utils_perf - WARNING - full garbage collections took 49% CPU time recently (threshold: 10%)
distributed.utils_perf - WARNING - full garbage collections took 48% CPU time recently (threshold: 10%)
distributed.utils_perf - WARNING - full garbage collections took 49% CPU time recently (threshold: 10%)
distributed.utils_perf - WARNING - full garbage collections took 49% CPU time recently (threshold: 10%)
distributed.utils_perf - WARNING - full garbage collections took 49% CPU time recently (threshold: 10%)
distributed.utils_perf - WARNING - full garbage collections took 49% CPU time recently (threshold: 10%)
distributed.utils_perf - WARNING - full garbage collections took 49% CPU time recently (threshold: 10%)
distributed.utils_perf - WARNING - full garbage collections took 49% CPU time recently (threshold: 10%)
distributed.utils_perf - WARNING - full garbage collections took 49% CPU time recently (threshold: 10%)
distributed.utils_perf - WARNING - full garbage collections took 49% CPU time recently (threshold: 10%)
distributed.utils_perf - WARNING - full garbage collections took 49% CPU time recently (threshold: 10%)
distributed.utils_perf - WARNING - full garbage collections took 50% CPU time recently (threshold: 10%)
CPU times: user 1min 17s, sys: 7.21 s, total: 1min 24s
Wall time: 4min 22s
| North Axis | RangeParameter [0.1, 0.9] | DistrictCooling:Facility | DistrictHeating:Facility | violation | pareto-optimal | |
|---|---|---|---|---|---|---|
| 0 | 71.382076 | 0.437110 | 4.358714e+09 | 3.816222e+09 | 0 | False |
| 1 | 299.840962 | 0.701673 | 4.588401e+09 | 4.781656e+09 | 0 | False |
| 2 | 219.852640 | 0.601671 | 3.635201e+09 | 5.377198e+09 | 0 | False |
| 3 | 140.670862 | 0.863716 | 3.586940e+09 | 6.859501e+09 | 0 | False |
| 4 | 150.525194 | 0.878006 | 3.427311e+09 | 6.928445e+09 | 0 | False |
| 5 | 198.223895 | 0.476851 | 3.349558e+09 | 4.801244e+09 | 0 | False |
| 6 | 263.106277 | 0.526319 | 4.295008e+09 | 4.485197e+09 | 0 | False |
| 7 | 273.776699 | 0.723453 | 4.463784e+09 | 5.305216e+09 | 0 | False |
| 8 | 313.888573 | 0.633187 | 4.542461e+09 | 4.261052e+09 | 0 | False |
| 9 | 65.739115 | 0.844361 | 4.534472e+09 | 5.657544e+09 | 0 | False |
| 10 | 244.108264 | 0.139270 | 4.079191e+09 | 2.744689e+09 | 0 | True |
| 11 | 316.225471 | 0.356809 | 4.472947e+09 | 3.005892e+09 | 0 | False |
| 12 | 165.704853 | 0.142534 | 3.455403e+09 | 2.952677e+09 | 0 | True |
| 13 | 176.548539 | 0.519485 | 3.229829e+09 | 5.041344e+09 | 0 | True |
| 14 | 215.470655 | 0.240727 | 3.649903e+09 | 3.459326e+09 | 0 | False |
| 15 | 121.225588 | 0.438825 | 3.868790e+09 | 4.427992e+09 | 0 | False |
| 16 | 1.064533 | 0.271421 | 4.264107e+09 | 2.378304e+09 | 0 | True |
| 17 | 52.152901 | 0.657508 | 4.459781e+09 | 4.557195e+09 | 0 | False |
| 18 | 249.782177 | 0.105415 | 4.162442e+09 | 2.510717e+09 | 0 | True |
| 19 | 143.033784 | 0.609786 | 3.546025e+09 | 5.509415e+09 | 0 | False |
| 20 | 316.680927 | 0.578098 | 4.512892e+09 | 3.967078e+09 | 0 | False |
| 21 | 353.646224 | 0.350275 | 4.270387e+09 | 2.696923e+09 | 0 | False |
| 22 | 138.595062 | 0.513111 | 3.618218e+09 | 4.955166e+09 | 0 | False |
| 23 | 310.415717 | 0.124600 | 4.493048e+09 | 2.036819e+09 | 0 | False |
| 24 | 333.266753 | 0.647367 | 4.424149e+09 | 4.055692e+09 | 0 | False |
| 25 | 102.951632 | 0.144138 | 4.122826e+09 | 2.686456e+09 | 0 | True |
| 26 | 99.412952 | 0.195314 | 4.143610e+09 | 2.920224e+09 | 0 | False |
| 27 | 78.379686 | 0.312676 | 4.303378e+09 | 3.297800e+09 | 0 | False |
| 28 | 302.796971 | 0.106689 | 4.496140e+09 | 2.017476e+09 | 0 | False |
| 29 | 123.990886 | 0.234128 | 3.860546e+09 | 3.337713e+09 | 0 | False |
| 30 | 182.583857 | 0.419069 | 3.263349e+09 | 4.505705e+09 | 0 | True |
| 31 | 349.374379 | 0.165442 | 4.327295e+09 | 1.963931e+09 | 0 | True |
| 32 | 300.042979 | 0.520984 | 4.523363e+09 | 3.929705e+09 | 0 | False |
| 33 | 162.525322 | 0.310286 | 3.381877e+09 | 3.891765e+09 | 0 | True |
| 34 | 293.523382 | 0.261707 | 4.468832e+09 | 2.817049e+09 | 0 | False |
| 35 | 10.117742 | 0.300807 | 4.260468e+09 | 2.529534e+09 | 0 | False |
| 36 | 185.075163 | 0.356574 | 3.296258e+09 | 4.145815e+09 | 0 | True |
| 37 | 86.822357 | 0.513505 | 4.278318e+09 | 4.398771e+09 | 0 | False |
| 38 | 342.138876 | 0.202175 | 4.351387e+09 | 2.138354e+09 | 0 | False |
| 39 | 158.379348 | 0.613572 | 3.336195e+09 | 5.571146e+09 | 0 | False |
| 40 | 48.678043 | 0.623399 | 4.439759e+09 | 4.330768e+09 | 0 | False |
| 41 | 131.721176 | 0.403263 | 3.726968e+09 | 4.324951e+09 | 0 | False |
| 42 | 1.275195 | 0.263956 | 4.264487e+09 | 2.366280e+09 | 0 | True |
| 43 | 216.565201 | 0.652247 | 3.577040e+09 | 5.712885e+09 | 0 | False |
| 44 | 29.507229 | 0.861832 | 4.449814e+09 | 5.129074e+09 | 0 | False |
| 45 | 177.739171 | 0.872205 | 3.168680e+09 | 6.964722e+09 | 0 | True |
| 46 | 103.169745 | 0.727197 | 4.162633e+09 | 5.721400e+09 | 0 | False |
| 47 | 183.466568 | 0.639685 | 3.203489e+09 | 5.699981e+09 | 0 | True |
| 48 | 11.305850 | 0.280824 | 4.265549e+09 | 2.457105e+09 | 0 | False |
| 49 | 199.381870 | 0.764400 | 3.312673e+09 | 6.374030e+09 | 0 | False |
Compare with sequential processing. The performance difference will be greater if your machine has more cores.
%%time
evaluatorEP = EvaluatorEP(problem, building)

results2 = NSGAII(
    evaluatorEP, evaluations=20, population_size=50
)  # Run the optimizer using this evaluator for a population size of 20 for 10 generations
results2
distributed.utils_perf - WARNING - full garbage collections took 49% CPU time recently (threshold: 10%)
distributed.utils_perf - WARNING - full garbage collections took 50% CPU time recently (threshold: 10%)
distributed.utils_perf - WARNING - full garbage collections took 50% CPU time recently (threshold: 10%)
distributed.utils_perf - WARNING - full garbage collections took 49% CPU time recently (threshold: 10%)
distributed.utils_perf - WARNING - full garbage collections took 49% CPU time recently (threshold: 10%)
distributed.utils_perf - WARNING - full garbage collections took 49% CPU time recently (threshold: 10%)
distributed.utils_perf - WARNING - full garbage collections took 49% CPU time recently (threshold: 10%)
distributed.utils_perf - WARNING - full garbage collections took 49% CPU time recently (threshold: 10%)
distributed.utils_perf - WARNING - full garbage collections took 49% CPU time recently (threshold: 10%)
distributed.utils_perf - WARNING - full garbage collections took 48% CPU time recently (threshold: 10%)
distributed.utils_perf - WARNING - full garbage collections took 49% CPU time recently (threshold: 10%)
distributed.utils_perf - WARNING - full garbage collections took 48% CPU time recently (threshold: 10%)
distributed.utils_perf - WARNING - full garbage collections took 48% CPU time recently (threshold: 10%)
distributed.utils_perf - WARNING - full garbage collections took 49% CPU time recently (threshold: 10%)
distributed.utils_perf - WARNING - full garbage collections took 49% CPU time recently (threshold: 10%)
distributed.utils_perf - WARNING - full garbage collections took 48% CPU time recently (threshold: 10%)
distributed.utils_perf - WARNING - full garbage collections took 49% CPU time recently (threshold: 10%)
distributed.utils_perf - WARNING - full garbage collections took 48% CPU time recently (threshold: 10%)
distributed.utils_perf - WARNING - full garbage collections took 48% CPU time recently (threshold: 10%)
distributed.utils_perf - WARNING - full garbage collections took 48% CPU time recently (threshold: 10%)
distributed.utils_perf - WARNING - full garbage collections took 48% CPU time recently (threshold: 10%)
distributed.utils_perf - WARNING - full garbage collections took 49% CPU time recently (threshold: 10%)
distributed.utils_perf - WARNING - full garbage collections took 49% CPU time recently (threshold: 10%)
distributed.utils_perf - WARNING - full garbage collections took 48% CPU time recently (threshold: 10%)
distributed.utils_perf - WARNING - full garbage collections took 49% CPU time recently (threshold: 10%)
distributed.utils_perf - WARNING - full garbage collections took 50% CPU time recently (threshold: 10%)
distributed.utils_perf - WARNING - full garbage collections took 49% CPU time recently (threshold: 10%)
distributed.utils_perf - WARNING - full garbage collections took 50% CPU time recently (threshold: 10%)
distributed.utils_perf - WARNING - full garbage collections took 50% CPU time recently (threshold: 10%)
distributed.utils_perf - WARNING - full garbage collections took 49% CPU time recently (threshold: 10%)
distributed.utils_perf - WARNING - full garbage collections took 50% CPU time recently (threshold: 10%)
distributed.utils_perf - WARNING - full garbage collections took 49% CPU time recently (threshold: 10%)
distributed.utils_perf - WARNING - full garbage collections took 49% CPU time recently (threshold: 10%)
distributed.utils_perf - WARNING - full garbage collections took 50% CPU time recently (threshold: 10%)
distributed.utils_perf - WARNING - full garbage collections took 49% CPU time recently (threshold: 10%)
distributed.utils_perf - WARNING - full garbage collections took 50% CPU time recently (threshold: 10%)
distributed.utils_perf - WARNING - full garbage collections took 50% CPU time recently (threshold: 10%)
distributed.utils_perf - WARNING - full garbage collections took 50% CPU time recently (threshold: 10%)
distributed.utils_perf - WARNING - full garbage collections took 51% CPU time recently (threshold: 10%)
distributed.utils_perf - WARNING - full garbage collections took 50% CPU time recently (threshold: 10%)
distributed.utils_perf - WARNING - full garbage collections took 50% CPU time recently (threshold: 10%)
distributed.utils_perf - WARNING - full garbage collections took 50% CPU time recently (threshold: 10%)
distributed.utils_perf - WARNING - full garbage collections took 50% CPU time recently (threshold: 10%)
distributed.utils_perf - WARNING - full garbage collections took 50% CPU time recently (threshold: 10%)
distributed.utils_perf - WARNING - full garbage collections took 50% CPU time recently (threshold: 10%)
distributed.utils_perf - WARNING - full garbage collections took 50% CPU time recently (threshold: 10%)
distributed.utils_perf - WARNING - full garbage collections took 50% CPU time recently (threshold: 10%)
distributed.utils_perf - WARNING - full garbage collections took 50% CPU time recently (threshold: 10%)
distributed.utils_perf - WARNING - full garbage collections took 50% CPU time recently (threshold: 10%)
distributed.utils_perf - WARNING - full garbage collections took 49% CPU time recently (threshold: 10%)
distributed.utils_perf - WARNING - full garbage collections took 50% CPU time recently (threshold: 10%)
distributed.utils_perf - WARNING - full garbage collections took 50% CPU time recently (threshold: 10%)
distributed.utils_perf - WARNING - full garbage collections took 50% CPU time recently (threshold: 10%)
distributed.utils_perf - WARNING - full garbage collections took 50% CPU time recently (threshold: 10%)
distributed.utils_perf - WARNING - full garbage collections took 49% CPU time recently (threshold: 10%)
distributed.utils_perf - WARNING - full garbage collections took 50% CPU time recently (threshold: 10%)
distributed.utils_perf - WARNING - full garbage collections took 50% CPU time recently (threshold: 10%)
distributed.utils_perf - WARNING - full garbage collections took 50% CPU time recently (threshold: 10%)
distributed.utils_perf - WARNING - full garbage collections took 49% CPU time recently (threshold: 10%)
distributed.utils_perf - WARNING - full garbage collections took 49% CPU time recently (threshold: 10%)
distributed.utils_perf - WARNING - full garbage collections took 49% CPU time recently (threshold: 10%)
distributed.utils_perf - WARNING - full garbage collections took 49% CPU time recently (threshold: 10%)
distributed.utils_perf - WARNING - full garbage collections took 49% CPU time recently (threshold: 10%)
distributed.utils_perf - WARNING - full garbage collections took 49% CPU time recently (threshold: 10%)
distributed.utils_perf - WARNING - full garbage collections took 49% CPU time recently (threshold: 10%)
distributed.utils_perf - WARNING - full garbage collections took 49% CPU time recently (threshold: 10%)
distributed.utils_perf - WARNING - full garbage collections took 49% CPU time recently (threshold: 10%)
distributed.utils_perf - WARNING - full garbage collections took 49% CPU time recently (threshold: 10%)
distributed.utils_perf - WARNING - full garbage collections took 49% CPU time recently (threshold: 10%)
distributed.utils_perf - WARNING - full garbage collections took 49% CPU time recently (threshold: 10%)
distributed.utils_perf - WARNING - full garbage collections took 49% CPU time recently (threshold: 10%)
distributed.utils_perf - WARNING - full garbage collections took 49% CPU time recently (threshold: 10%)
distributed.utils_perf - WARNING - full garbage collections took 49% CPU time recently (threshold: 10%)
distributed.utils_perf - WARNING - full garbage collections took 49% CPU time recently (threshold: 10%)
distributed.utils_perf - WARNING - full garbage collections took 49% CPU time recently (threshold: 10%)
distributed.utils_perf - WARNING - full garbage collections took 49% CPU time recently (threshold: 10%)
distributed.utils_perf - WARNING - full garbage collections took 49% CPU time recently (threshold: 10%)
distributed.utils_perf - WARNING - full garbage collections took 49% CPU time recently (threshold: 10%)
distributed.utils_perf - WARNING - full garbage collections took 49% CPU time recently (threshold: 10%)
distributed.utils_perf - WARNING - full garbage collections took 48% CPU time recently (threshold: 10%)
distributed.utils_perf - WARNING - full garbage collections took 48% CPU time recently (threshold: 10%)
distributed.utils_perf - WARNING - full garbage collections took 48% CPU time recently (threshold: 10%)
distributed.utils_perf - WARNING - full garbage collections took 48% CPU time recently (threshold: 10%)
distributed.utils_perf - WARNING - full garbage collections took 48% CPU time recently (threshold: 10%)
distributed.utils_perf - WARNING - full garbage collections took 48% CPU time recently (threshold: 10%)
distributed.utils_perf - WARNING - full garbage collections took 49% CPU time recently (threshold: 10%)
distributed.utils_perf - WARNING - full garbage collections took 49% CPU time recently (threshold: 10%)
distributed.utils_perf - WARNING - full garbage collections took 49% CPU time recently (threshold: 10%)
distributed.utils_perf - WARNING - full garbage collections took 49% CPU time recently (threshold: 10%)
distributed.utils_perf - WARNING - full garbage collections took 49% CPU time recently (threshold: 10%)
distributed.utils_perf - WARNING - full garbage collections took 49% CPU time recently (threshold: 10%)
distributed.utils_perf - WARNING - full garbage collections took 49% CPU time recently (threshold: 10%)
distributed.utils_perf - WARNING - full garbage collections took 49% CPU time recently (threshold: 10%)
distributed.utils_perf - WARNING - full garbage collections took 49% CPU time recently (threshold: 10%)
distributed.utils_perf - WARNING - full garbage collections took 49% CPU time recently (threshold: 10%)
distributed.utils_perf - WARNING - full garbage collections took 49% CPU time recently (threshold: 10%)
distributed.utils_perf - WARNING - full garbage collections took 50% CPU time recently (threshold: 10%)
distributed.utils_perf - WARNING - full garbage collections took 50% CPU time recently (threshold: 10%)
distributed.utils_perf - WARNING - full garbage collections took 50% CPU time recently (threshold: 10%)
distributed.utils_perf - WARNING - full garbage collections took 50% CPU time recently (threshold: 10%)
distributed.utils_perf - WARNING - full garbage collections took 50% CPU time recently (threshold: 10%)
distributed.utils_perf - WARNING - full garbage collections took 51% CPU time recently (threshold: 10%)
distributed.utils_perf - WARNING - full garbage collections took 50% CPU time recently (threshold: 10%)
distributed.utils_perf - WARNING - full garbage collections took 51% CPU time recently (threshold: 10%)
distributed.utils_perf - WARNING - full garbage collections took 51% CPU time recently (threshold: 10%)
distributed.utils_perf - WARNING - full garbage collections took 51% CPU time recently (threshold: 10%)
distributed.utils_perf - WARNING - full garbage collections took 51% CPU time recently (threshold: 10%)
distributed.utils_perf - WARNING - full garbage collections took 51% CPU time recently (threshold: 10%)
distributed.utils_perf - WARNING - full garbage collections took 51% CPU time recently (threshold: 10%)
distributed.utils_perf - WARNING - full garbage collections took 51% CPU time recently (threshold: 10%)
distributed.utils_perf - WARNING - full garbage collections took 51% CPU time recently (threshold: 10%)
distributed.utils_perf - WARNING - full garbage collections took 51% CPU time recently (threshold: 10%)
distributed.utils_perf - WARNING - full garbage collections took 51% CPU time recently (threshold: 10%)
distributed.utils_perf - WARNING - full garbage collections took 52% CPU time recently (threshold: 10%)
distributed.utils_perf - WARNING - full garbage collections took 51% CPU time recently (threshold: 10%)
distributed.utils_perf - WARNING - full garbage collections took 51% CPU time recently (threshold: 10%)
distributed.utils_perf - WARNING - full garbage collections took 50% CPU time recently (threshold: 10%)
distributed.utils_perf - WARNING - full garbage collections took 50% CPU time recently (threshold: 10%)
distributed.utils_perf - WARNING - full garbage collections took 50% CPU time recently (threshold: 10%)
distributed.utils_perf - WARNING - full garbage collections took 50% CPU time recently (threshold: 10%)
distributed.utils_perf - WARNING - full garbage collections took 50% CPU time recently (threshold: 10%)
distributed.utils_perf - WARNING - full garbage collections took 51% CPU time recently (threshold: 10%)
distributed.utils_perf - WARNING - full garbage collections took 51% CPU time recently (threshold: 10%)
distributed.utils_perf - WARNING - full garbage collections took 51% CPU time recently (threshold: 10%)
distributed.utils_perf - WARNING - full garbage collections took 52% CPU time recently (threshold: 10%)
CPU times: user 1min 18s, sys: 7.16 s, total: 1min 25s
Wall time: 4min 24s
| North Axis | RangeParameter [0.1, 0.9] | DistrictCooling:Facility | DistrictHeating:Facility | violation | pareto-optimal | |
|---|---|---|---|---|---|---|
| 0 | 30.985142 | 0.163250 | 4.349064e+09 | 2.082418e+09 | 0 | False |
| 1 | 343.986723 | 0.169553 | 4.351741e+09 | 1.989796e+09 | 0 | False |
| 2 | 132.588809 | 0.857802 | 3.723984e+09 | 6.712684e+09 | 0 | False |
| 3 | 190.390483 | 0.866152 | 3.210981e+09 | 6.919259e+09 | 0 | False |
| 4 | 100.434378 | 0.217507 | 4.131097e+09 | 3.051266e+09 | 0 | False |
| 5 | 140.594568 | 0.527184 | 3.588418e+09 | 5.003672e+09 | 0 | False |
| 6 | 77.647901 | 0.516704 | 4.345977e+09 | 4.285707e+09 | 0 | False |
| 7 | 314.122199 | 0.811703 | 4.609703e+09 | 5.047447e+09 | 0 | False |
| 8 | 169.806001 | 0.203200 | 3.390162e+09 | 3.303781e+09 | 0 | True |
| 9 | 165.192059 | 0.464310 | 3.304045e+09 | 4.733369e+09 | 0 | True |
| 10 | 145.527483 | 0.473950 | 3.525268e+09 | 4.786143e+09 | 0 | False |
| 11 | 200.301543 | 0.335061 | 3.421391e+09 | 3.996262e+09 | 0 | False |
| 12 | 343.129802 | 0.348334 | 4.323107e+09 | 2.727842e+09 | 0 | False |
| 13 | 240.045938 | 0.397933 | 3.971847e+09 | 4.120891e+09 | 0 | False |
| 14 | 258.371548 | 0.227977 | 4.226768e+09 | 3.067001e+09 | 0 | False |
| 15 | 130.386726 | 0.247904 | 3.776790e+09 | 3.453907e+09 | 0 | False |
| 16 | 297.282683 | 0.186413 | 4.477456e+09 | 2.427426e+09 | 0 | False |
| 17 | 349.005589 | 0.511571 | 4.290375e+09 | 3.406691e+09 | 0 | False |
| 18 | 35.508325 | 0.120319 | 4.373799e+09 | 1.939409e+09 | 0 | False |
| 19 | 24.584273 | 0.636252 | 4.338260e+09 | 4.077425e+09 | 0 | False |
| 20 | 251.397591 | 0.778559 | 4.188568e+09 | 5.923020e+09 | 0 | False |
| 21 | 302.012549 | 0.772594 | 4.617226e+09 | 5.055961e+09 | 0 | False |
| 22 | 18.579230 | 0.256936 | 4.290047e+09 | 2.381188e+09 | 0 | True |
| 23 | 14.957312 | 0.700940 | 4.302504e+09 | 4.249455e+09 | 0 | False |
| 24 | 212.302359 | 0.646037 | 3.510443e+09 | 5.654748e+09 | 0 | False |
| 25 | 115.506297 | 0.197162 | 3.972348e+09 | 3.077225e+09 | 0 | False |
| 26 | 257.504799 | 0.581287 | 4.235221e+09 | 4.840406e+09 | 0 | False |
| 27 | 88.075640 | 0.809222 | 4.367557e+09 | 5.851124e+09 | 0 | False |
| 28 | 183.278163 | 0.741978 | 3.186143e+09 | 6.270258e+09 | 0 | True |
| 29 | 164.797852 | 0.341820 | 3.349166e+09 | 4.071505e+09 | 0 | True |
| 30 | 295.145998 | 0.781863 | 4.612272e+09 | 5.191414e+09 | 0 | False |
| 31 | 2.860968 | 0.753246 | 4.287888e+09 | 4.410980e+09 | 0 | False |
| 32 | 280.331651 | 0.618450 | 4.480270e+09 | 4.682645e+09 | 0 | False |
| 33 | 283.899973 | 0.699313 | 4.533249e+09 | 5.019736e+09 | 0 | False |
| 34 | 266.522936 | 0.407446 | 4.314406e+09 | 3.875891e+09 | 0 | False |
| 35 | 17.843621 | 0.115373 | 4.329252e+09 | 1.787127e+09 | 0 | True |
| 36 | 298.905998 | 0.132525 | 4.486058e+09 | 2.177395e+09 | 0 | False |
| 37 | 125.376380 | 0.172816 | 3.864726e+09 | 3.013039e+09 | 0 | False |
| 38 | 109.539891 | 0.834102 | 4.102117e+09 | 6.326264e+09 | 0 | False |
| 39 | 37.087412 | 0.294448 | 4.349793e+09 | 2.732459e+09 | 0 | False |
| 40 | 202.925823 | 0.150535 | 3.547252e+09 | 2.985553e+09 | 0 | False |
| 41 | 73.714102 | 0.321960 | 4.329891e+09 | 3.290820e+09 | 0 | False |
| 42 | 265.457728 | 0.714138 | 4.369641e+09 | 5.371035e+09 | 0 | False |
| 43 | 222.357877 | 0.677068 | 3.675527e+09 | 5.800385e+09 | 0 | False |
| 44 | 277.956637 | 0.880495 | 4.562398e+09 | 5.955538e+09 | 0 | False |
| 45 | 87.852259 | 0.120677 | 4.257516e+09 | 2.436282e+09 | 0 | True |
| 46 | 82.075521 | 0.416412 | 4.291953e+09 | 3.830479e+09 | 0 | False |
| 47 | 98.638003 | 0.502126 | 4.159454e+09 | 4.495173e+09 | 0 | False |
| 48 | 222.271467 | 0.613171 | 3.675789e+09 | 5.454972e+09 | 0 | False |
| 49 | 188.976525 | 0.123347 | 3.454562e+09 | 2.834408e+09 | 0 | True |
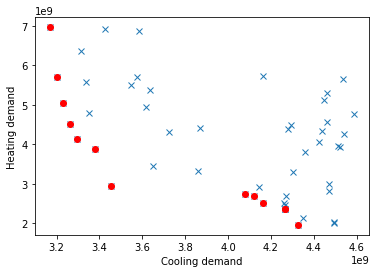
optres = results.loc[
    results["pareto-optimal"] == True, :
]  # Get only the optimal results
plt.plot(
    results["DistrictCooling:Facility"], results["DistrictHeating:Facility"], "x"
)  # Plot all results in the background
plt.plot(
    optres["DistrictCooling:Facility"], optres["DistrictHeating:Facility"], "ro"
)  # Plot optimal results in red
plt.xlabel("Cooling demand")
plt.ylabel("Heating demand")
Text(0, 0.5, 'Heating demand')
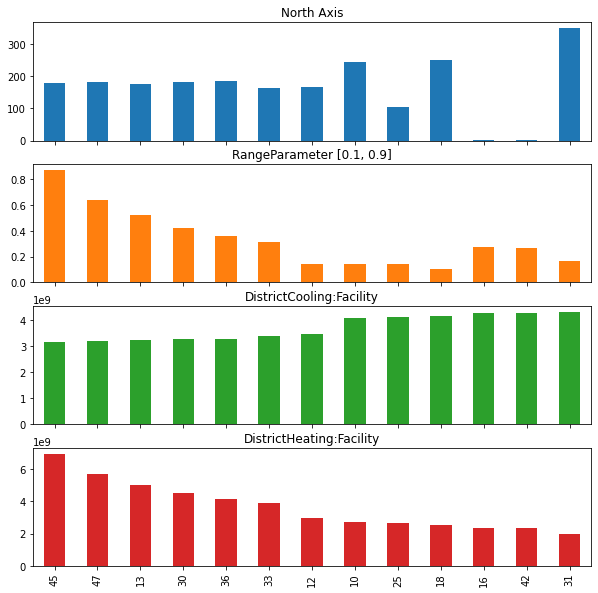
Visualize the results
optres = optres.sort_values("DistrictCooling:Facility")  # Sort by the first objective
optresplot = optres.drop(columns="violation")  # Remove the constraint violation column
ax = optresplot.plot.bar(
    subplots=True, legend=None, figsize=(10, 10)
)  # Plot the variable values of each of the optimal solutions
/usr/local/lib/python3.7/dist-packages/pandas/plotting/_matplotlib/tools.py:307: MatplotlibDeprecationWarning:
The rowNum attribute was deprecated in Matplotlib 3.2 and will be removed two minor releases later. Use ax.get_subplotspec().rowspan.start instead.
  layout[ax.rowNum, ax.colNum] = ax.get_visible()
/usr/local/lib/python3.7/dist-packages/pandas/plotting/_matplotlib/tools.py:307: MatplotlibDeprecationWarning:
The colNum attribute was deprecated in Matplotlib 3.2 and will be removed two minor releases later. Use ax.get_subplotspec().colspan.start instead.
  layout[ax.rowNum, ax.colNum] = ax.get_visible()
/usr/local/lib/python3.7/dist-packages/pandas/plotting/_matplotlib/tools.py:313: MatplotlibDeprecationWarning:
The rowNum attribute was deprecated in Matplotlib 3.2 and will be removed two minor releases later. Use ax.get_subplotspec().rowspan.start instead.
  if not layout[ax.rowNum + 1, ax.colNum]:
/usr/local/lib/python3.7/dist-packages/pandas/plotting/_matplotlib/tools.py:313: MatplotlibDeprecationWarning:
The colNum attribute was deprecated in Matplotlib 3.2 and will be removed two minor releases later. Use ax.get_subplotspec().colspan.start instead.
  if not layout[ax.rowNum + 1, ax.colNum]:
client.restart()
distributed.nanny - WARNING - Restarting worker
distributed.nanny - WARNING - Restarting worker
distributed.nanny - WARNING - Restarting worker
distributed.nanny - WARNING - Restarting worker
Client
|
Cluster
|